Dear Families,
We are piloting a new math program in third grade. We will be sending out videos that explain the math and how students will be learning it. These will help you to ask questions at home and find ways to help support your mathematician!
Also, we are currently working on graphs and below is an overview of the work we are doing now:
Section A: Interpret and Represent Data on Scaled Graphs
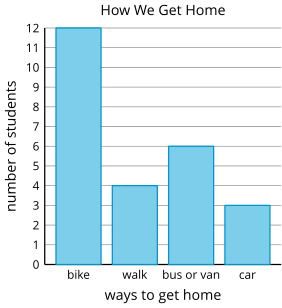
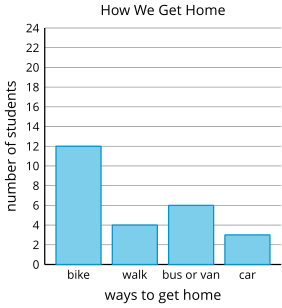
In this section, students make sense of and draw picture graphs and bar graphs. They see that each picture in a picture graph, or each step on a bar graph, can represent more than one object. They work with scales of 2, 5, and 10 (where each picture or step represents 2 objects, 5 objects, or 10 objects).
Students use the scaled bar graphs to solve “how many more” and “how many fewer” problems where the numbers are within 100.
bar graph 
scaled bar graph
As always, if you have any questions about math or further ways to support your children email your classroom teachers!
